Over the years we have come to love Google as a search engine and a de facto home page for browsers for many of us. The ability to find the desired info from a heap of available data can truly be an empowering and time saving experience. Such experience when extended to business can help customers to discover products and services faster and much more accurately, resulting in better experience and increased business. At the forefront of this technology for businesses is the Elastic Stack. Formerly known as the ELK stack with Elastic Search at the centre of it, with addition of a few more tools, the solution is now known as the Elastic Stack.
Elastic Search
Elastic Search is an open source analytics and full text search engine. It can be used to enable search functionality for applications. We can use it for a an ecommerce application or a personal blog where we want users to search for posts by typing in the search bar. We can build complex search functionalities like auto-completion, matching highlights, considering synonyms, correcting typos, much like what we see in Google.

Take for example any popular ecommerce web application (like Amazon) where we want to enable text search for finding books. Apart from basic text search, we also want to add features like bringing popular results on the top, ability to filter the results by ratings, price etc or sort the results on the basis of a parameter. Elastic Search will help you build a powerful search engine which will enable all of the above mentioned features and more.

Beyond Search Engine
Elastic Search, despite by its name, is not limited just to search. You can also query the structured data and use the platform as an analytics engine. Elastic Search is not meant to be a full blown data analytics platform but you can still get a lot of value from its analytics capability. For an ecommerce website like discussed above, we can use elastic search analytics for various purposes:
Application Performance Management: We can store the server logs and performance metric data of our applications in elastic search. We can setup alerts on certain metrics like CPU or memory usage and elastic search will tell us about performance of our applications and servers.
Send events to ElasticSearch: We can also send various events in our website to Elasticsearch. These could be number of visitors, clicks, scrolls, location and other customer interaction data on the website. Elastic search can do aggregation of data and give you insight about your users like the location where most of your users are from.
Analysis with machine learning: We can also use Elastic search along with machine learning to do analysis of data and use it for forecasts and capacity planning by predicting future possibilities on the basis of historical data stored in Elastic Search. With the data on number of daily visitors, we can predict strong and weak months and which products perform well in those months. Machine learning can also alert you automatically whenever there is a deviation from observed regularity like sudden drop in number of visitors on a day.
How does it work
In Elastic Search, data is stored as documents which are written in JSON. Each document has fields which are divided into field names and field values. We can think of documents as rows and fields as columns in relational database structures. Below is an example of a JSON document:

In simple words, we have added a row for a user with columns for name, lastname and job_description with corresponding values, all of this in a JSON document form. We also have concept of index and type which one can think of as folders and subfolders. If I have a lot of data about movies and songs in my elastic search, I would like to make separate folder for movies and another one for songs. Inside Movies folder, I would also like to make subfolders for different genres like Romance, Action, Horror etc. In this way, I have added indexes(folders) and types(subfolders). In the above example, we have created an index named accounts and a type named person. We have given this person an ID called 1 and added the document. In order to make searches for movies better, we can also create horizontal separation called shards where we store movies separately on the basis of a parameter like year of release. Thus, when Elastic search has to search for a movie which was released in 2007, it will only look in the shard created for movies released in year 2005-2009. This will reduce the overall search time.
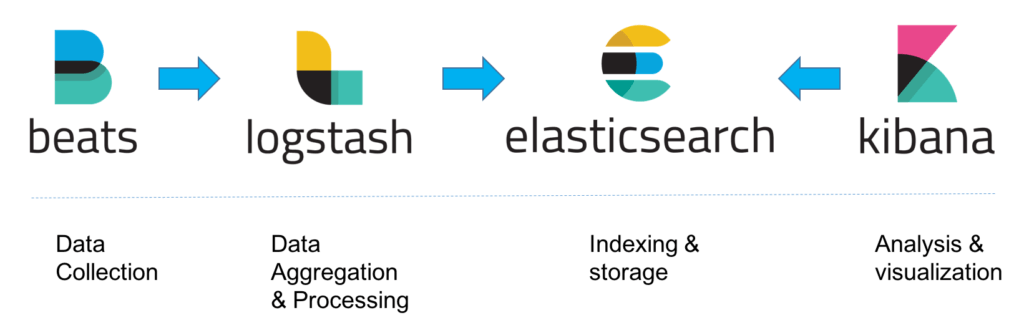
As great as Elastic Search is, it is not a complete solution on its own. Therefore, we have a number of solutions which surround Elastic Search and make it a formidable solution to use. These solutions together are known as Elastic Stack. Lets look at them now:
Kibana
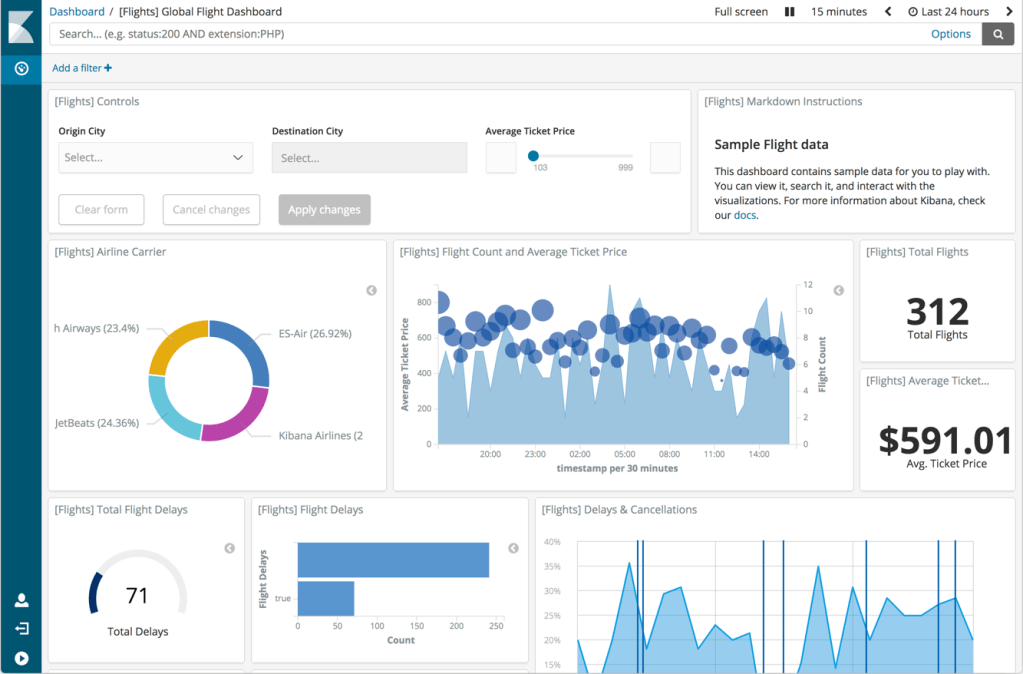
Kibana is a dashboard tool that is used for visualization of data in Elastic Search. All the features that we spoke about Elastic Search, can be visualized on Kibana, like predictions, recommendations, anomaly detections. Basically, Kibana can be looked upon as a UI functionality of Elastic Search. However, Kibana also handles certain parts of Elastic Search, such as authentication and authorization. You can create dashboards on Kibana and run various aggregations on it, and it will fetch data from Elastic search and show it to you in form on pie charts and graphs. This is where Elastic Search + Kibana becomes a useful analytics solution. Below is a Kibana dashboard for Elastic Search that has sample flights data.
LogStash
Logstash was traditionally used to process logs from applications and send them to Elastic search. However, with a number of input plugins available, Logstash is now used for receiving much more diverse data. All data that is sent to Logstash is treated as events, it could be application logs, ecommerce order data, customer acquisition data, support chat messages etc. These events are then processed and then sent to one or more destinations like Elastic Search, Kafka queue, email server etc. In this way, Logstash has now become a data processing pipeline service. Logstash gets this functionality using plugins at its three stages: input, filter and output. Input plugins add functionality of sending data to logstash. There are various plugins available like sending data to logstash from Kafka queue, relational database, http endpoint etc. Once Logstash receives input from input plugins, it can do data processing, enrichment, conversion using filter plugins. Output plugins enable destination for sending the processed data to various destinations like Elastic Search, email, kafka queue etc. One example of this flow could be sending visitors data from the ecommerce website to logstash using http input plugin. Logstash will look up the IP address of the visitor from the data and resolve geographical location using filter plugin and then finally send that data to elastic search for storage.

X-Pack
X-Pack is a list of functionality plugins that add various features to Elastic Search and Kibana. Some of the useful plugins are:
Security: This adds authentication and authorization to Kibana. Role based access can be given to users and integration with existing LDAP and Active Directory can also be done.
Monitoring: This pack allows monitoring of Elastic Search, Logstash and Kibana. Various metrics can be monitored and alerts can be setup on the basis of these metrics.
Reporting: This enables us to export visualization and dashboards of Kibana in form of PDF and CSV files. You can also customize the reports and schedule them at regular intervals.
Machine Learning: This enables activating machine learning on data in elastic search. This can be used for forecasting, anomaly detection and capacity planning.
Graph: This pack enables a recommendation engine for the data stored in elastic search. You can use API exposed by this pack in your ecommerce website and it will add recommendations for every user on the basis of their purchases and product discovery.
Elastic Search SQL: This pack enables interacting with Elastic Search in SQL language. This is used to translate JSON(query DSL actually) to SQL language and vice-versa. This enables database developers to query in SQL in Elastic search without having to learn JSON or query DSL.
Beats
Beats is a collection of data shipper light weight agents which send specific metric data about the server in which they are installed on. Few of the popular beat agents are:
Filebeat: Used for collecting log files and sending them to logstash or elastic search.
Metricbeat: Used for collecting system level operational data like CPU, memory usage etc, and send it to logstash or elastic search.
Heartbeat: Monitors service uptime
Auditbeat: Collects audit data from Linux servers.
Winlogbeat: Collects Windows Events logs.
Packetbeat: Collects network data
That’t it folks. All of these above services in combination are known as the Elastic Stack.
The Elastic Stack can be downloaded and deployed using guides available at elastic.co. But customers who want to deploy elastic stack at a large scale for complex use cases should look at managed Elastic Search service available on various public cloud platforms like Alibaba Cloud Elastic Search.
Alibaba Cloud Elasticsearch is a cloud-based Service that offers built-in integrations such as Kibana, commercial features, and Alibaba Cloud VPC, Cloud Monitor, and Resource Access Management. With Pay-As-You-Go billing, Alibaba Cloud Elasticsearch costs 30% less than self-built solutions and saves you the hassle of maintaining and scaling your platform.
Cover Photo by Luke Chesser on Unsplash
