With containers and microservices in it, it is easy to get into a situation where you have hundreds of pods spread across many nodes resulting in a difficult task of monitoring what is happening in all those applications and their hosts. Imagine a situation where various microservices are running on pods in different nodes, and one of the pods is kicked out of the node because the node has run out of memory.
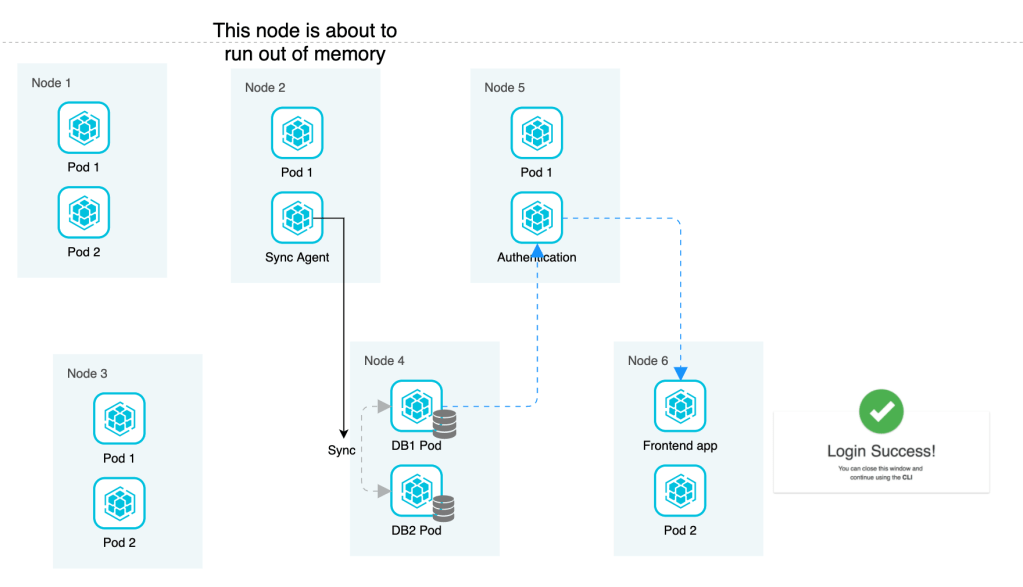
The pod that got kicked out was running a syncronizing application that works on syncing two copies of database together. With the application pod down, the sync does not happen anymore, which results in database not working as expected as latest data is not being synced. This database in turn hosts authentication data that is used by the authentication module which is hosted in another pod in a node. And this authentication application is used on the application UI to securely log in the user. With the database now not working, the authentication module also stops working which in turn fails to authenticate the users and they see a login error on their application UI.
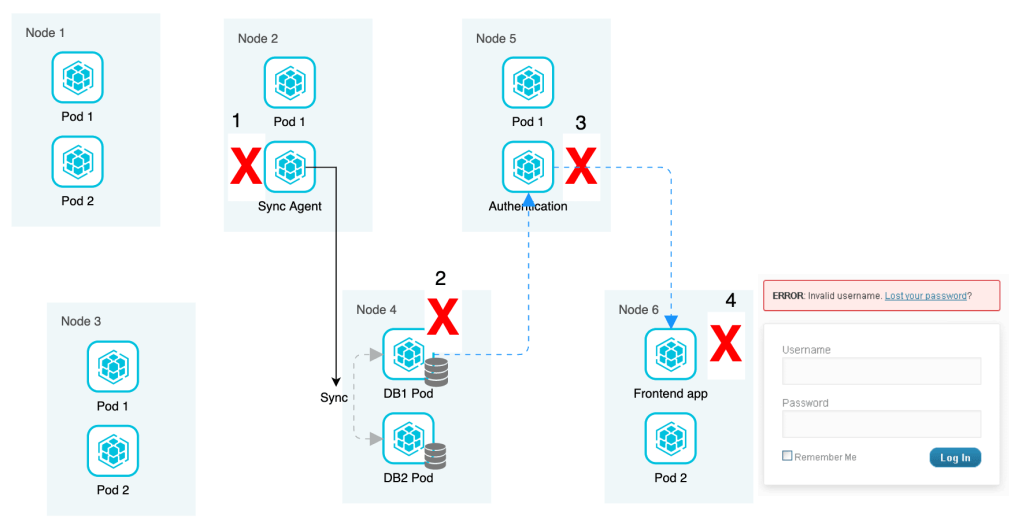
With the issue escalating, the technical team digs deep into the authentication module trying to figure out what is wrong. Even though the issue has emerged from the pod hosting sync agent, it would take the team long hours and a lot of reverse tracing to identify the real cause and hence fix the cascading error that lack of memory in one of the nodes caused.
This is the kind of issue that gets increasingly common in a kubernetes world where we have several microservices running in the cluster and the monitoring team does not have proactive access to crucial application and node metrics. Prometheus is one of the popular solutions that helps monitor such distributed environments with ease and proactively equips the monitoring team with important data about the cluster. Prometheus has inbuilt alert mechanism that can be triggered whenever any metric (like memory usage or disk space) goes beyond a threshold. This way, the admin can take action and fix the situation before it becomes an issue.
Components of Prometheus
Prometheus server
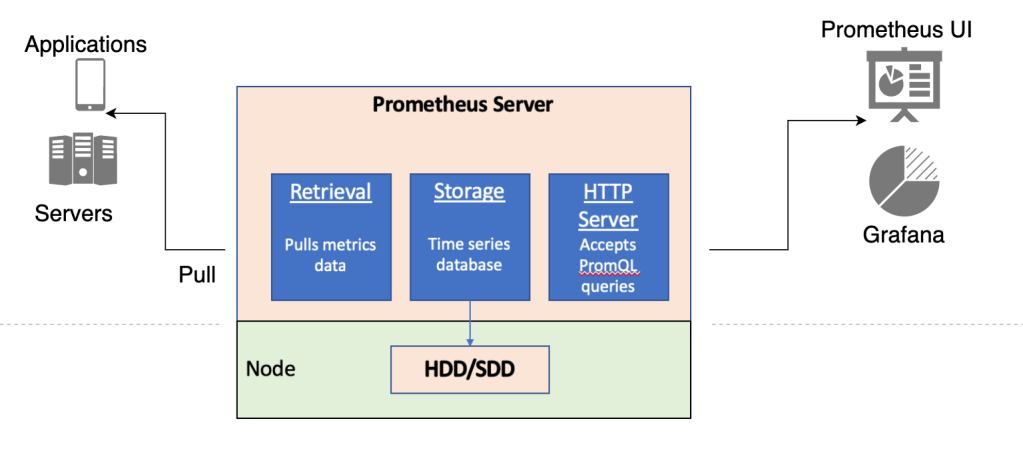
The main component of Prometheus is the server which manages the “how to capture metrics”, “where to store metrics” and “what to do with metrics” part. The Prometheus server consists are following three parts:
Data Retrieval Worker (how to capture metrics): The retrieval worker is responsible for pulling metrics data from applications, hosts, servers etc. It gathers all the important metrics and push it to the storage.
Time Series Database (where to store metrics): The Time series database receives metrics from retrieval worker and stores all the metrics data. The database uses data disks of the underlying node for storage.
HTTP Server (what to do with metrics): This server accepts queries in a language called PromQL (Prometheus Query Language), and works on the data to retrieve the query result and display on Prometheus UI through a server API. We can also use third party tools like Grafana if we don’t want to use Prometheus inbuilt UI solution.
Prometheus pulls data from target over an HTTP endpoint. The default endpoint is hostaddress/metrics. Therefore, the target applications must expose their /metrics endpoint and data available at this endpoint should be of the format acceptable by Prometheus. Many services (like Kubernetes) have inbuilt prometheus endpoints so we don’t have to add any configuration from our side. But there are services where no pre-built prometheus endpoint is present, which is where we use another component called exporter.
Exporter
An exporter is a service which when installed in a server can perform the below actions:
- Fetch metrics from the server as required by Prometheus.
- Converts them to correct format which is accepted by Prometheus.
- Expose the metrics at /metrics endpoint which then can be targeted by the retrieval worker.
Prometheus has provided exporters for third party services like Linux servers, HAProxy, MongoDB, Elastic Search, and many more on their official website. These exporters are also available as docker images for use in containerized environments.
How to use an exporter (for eg) in a linux server:
- Download the exporter from the official website.
- Untar and execute.
- The exporter will start converting metrics of the server to correct format.
- Exporter will expose /metrics endpoint of the server.
- Configure Prometheus to scrape this endpoint. (The activity of Prometheus Retrieval worker getting metrics from the source is called scraping).
Client Libraries
Apart from third party applications, we can also use Prometheus to monitor data in our custom applications. In order to scrape these custom applications, we can make use of client libraries that Prometheus has provided. We can find libraries for Go, Java, Scala, Python etc on the official website and use them to instrument our application code.
Push Gateway
Even though Prometheus retrieval agent pulls metrics from various sources, there are some scenarios, like short lived jobs, which are not present for long enough to be scraped. These could be small batch or scheduled jobs that run in the application for purpose like cleansing data, taking backup etc. For such jobs, Prometheus has a component called Push Gateway which would enable these jobs to push metrics to Prometheus before they exit.
Alert Manager
Alert manager is the component in Prometheus that manages sending alerts on the basis of rules that have been set in the configuration file (we will get to this in a minute). So if we have set up that whenever the CPU usage of a node goes beyond 70% for 10 minutes, we should be alerted via push notification, email and on slack, the alert manager will manage this and alert us on the mentioned channels whenever the CPU usage exceeds the threshold.

source: prometheus.io
Advantages of Pull based mechanism
Most of the monitoring systems like AWS Cloud Watch, New Relic etc follow a push based mechanism to collect metrics from sources. In this, the source applications and nodes have to push metrics data to a centralized collection point. This mechanism can have a few drawbacks:
- With hundreds of microservices and pods constantly sending metrics data to the collection point, it can overwhelm the network and the monitoring system can become a bottleneck for performance.
- This can be further aggravated in cases where one application has gone down and is now constantly sending endless error messages over the network further creating network issues.
- From a security perspective, if a hacker has acquired access to one of the servers in the network, it can overload the entire network by sending denial of service attacks to the centralized monitoring collection point.
- In push based mechanism, push agents are needed to be installed in all source points while in pull based mechanism, we just have to expose the correct endpoint which then can be scraped.
- Not receiving push data from a source does not give us accurate information about whether the application is down or the data is not reaching the collection point because of a network issue.
Configuring Prometheus
Prometheus configuration is done in a YAML file called prometheus.yml. There are three major blocks in the configuration:
global:
  scrape_interval:     15s
  evaluation_interval: 15s

rule_files:
  # - "first.rules"
  # - "second.rules"

scrape_configs:
  - job_name: prometheus
    static_configs:
- targets: ['localhost:9090']Global: These are the global values which are applicable on all configurations. These can be overridden for individual targets. Here we have two values:- scrape_interval which sets the interval for scraping the endpoint. Here, the endpoint will be scraped for metrics every 15 seconds. The second value is evaluation_interval which decides how often the rules will be evaluated against the data.
Rule_files: The rules are mentioned in this block. An example of a rule would be to check for mean latency for a request and file an alert if the latency is more than 0.5 for continuous 10 minutes. We can also add suitable labels and annotations to the rule.
rules:
  - alert: HighRequestLatency
    expr: job:request_latency_seconds:mean5m{job="myjob"} > 0.5
    for: 10m
    labels:
      severity: page
    annotations:
      summary: High request latency
Scrape_configs: This block describes which resources can Prometheus monitor. In the example, we have the prometheus job which is the endpoint exposed by prometheus to monitor its own server. We can add various configs about third party and custom applications here.
Querying Prometheus
Prometheus can be queried using PromQL queries. These are simple format queries that directly target the HTTP server in Prometheus to pull results. An example of a PromQL query is:
Select all the values we have recorded within the last 5 minutes for all time series that have the metric name http_requests_total and a job label set to prometheus
http_requests_total{job="prometheus"}[5m]
Return the value of http_requests_total in the last 5 minutes:
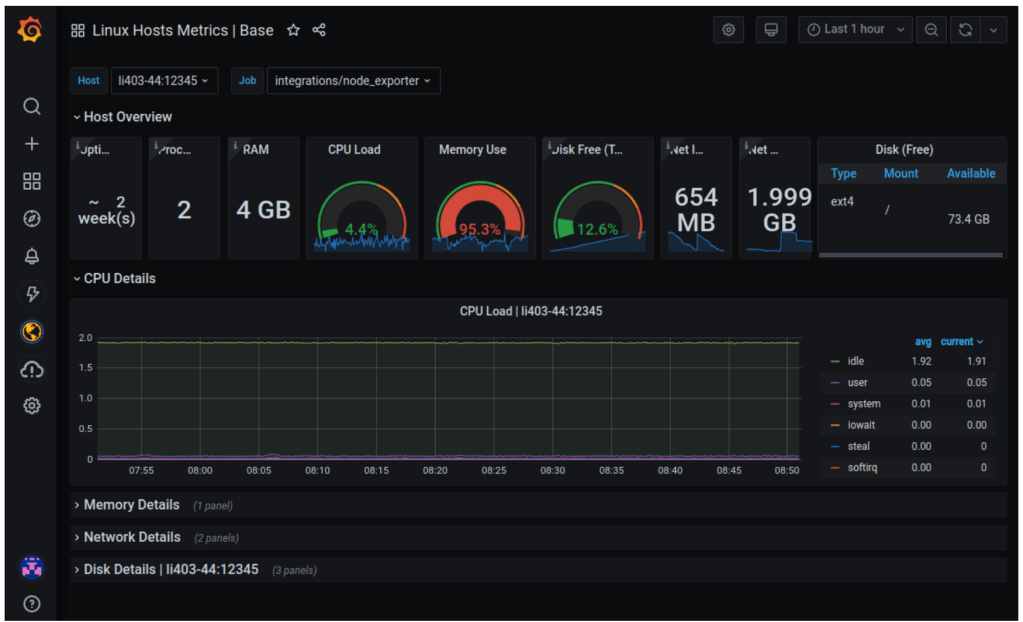
http_requests_total offset 5mEven though PromQL is the default way to query prometheus server, users often prefer a more UI friendly and visualized way to obtain and understand results. For this, we can use tools like Grafana. Grafana can connect seamlessly with Prometheus HTTP server and provide strong visualization features and detailed dashboards that can help us understand and monitor our applications easily. We can find a quick tutorial to test both prometheus and grafana for out test linux server here. It should give us a dashboard which monitors various components of our server, and look somewhat like this: